
Smart researchers, environmental scientists, and policy-makers seeking to understand environmental changes through spatial data analysis hail the use of ArcGIS as a tool of climate change analysis. I don’t see any sane reason why students shouldn’t, too! Think about this: climate change continues to affect ecosystems, weather patterns, biodiversity, agriculture, and urban development. Could we really do without advanced mapping and geospatial technologies for accurate environmental monitoring and evidence-based decision-making? No way!
Why ArcGIS in Climate Change Analysis?
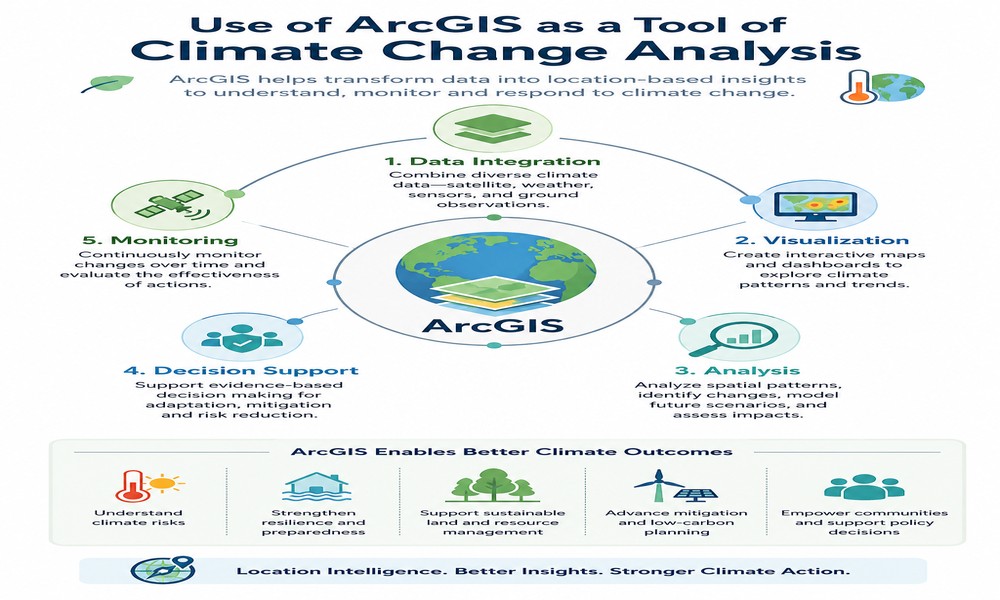
ArcGIS is increasingly used in climate science because users can visualize, analyze, and accurately interpret geographical / environmental data. ArcGIS supports climate researchers who assess risks to keep tabs on environmental trends and develop sustainable adaptation strategies through geospatial analysis, remote sensing, satellite imagery, or predictive modeling.
Climate change studies demand accurate data collection, precise environmental modeling, and pin-point spatial analysis to better understand the impacts of rising temperatures / sea levels, deforestation, or extreme weather. ArcGIS also helps research organizations to:
- Monitor land-use and land-cover changes aimed at better resource management
- Support disaster risk management
- Predict future climate patterns
- Assess environmental vulnerability for sustainable future plans
We’re the ONLY online geospatial analysis assignment help service with a full house of Climate Research Specialists.
3 Main Uses of ArcGIS as a Tool of Climate Change Analysis
Spatial Analysis of Climate Data
The primary use of ArcGIS is to analyze spatial climate data and identify environmental patterns or geographic changes. Researchers therefore use ArcGIS to:
- Map temperature variations
- Analyze rainfall distribution
- Monitor drought conditions
- Track glacier melting
- Evaluate flood-prone areas
- Assess sea-level rise impacts
- Study wildfire risk zones
- Identify regions vulnerable to climate-related disasters or environmental degradation
To improve the accuracy and reliability of climate research findings, ArcGIS allows seamless integration of:
- Geographic coordinates
- Environmental databases
- Meteorological records
- Satellite imagery, and
- Remote sensing datasets
Contact our 24/7/365 Helpdesk for assistance with your GIS Mapping Projects. Only Spatial Analysis Experts with years of practicing experience are allowed in that room!
Remote Sensing and Satellite Image Analysis
ArcGIS supports remote sensing technologies for researchers analyzing environmental changes using satellite imagery or aerial photography. I’ve seen climate analysts apply ArcGIS in:
- Monitoring deforestation
- Detecting desertification
- Tracking coastal erosion
- Assessing vegetation health
- Monitoring urban heat islands, and
- Evaluating air pollution patterns
The bunch of students we’ve worked with often combined ArcGIS with:
- Landsat imagery
- Drone mapping
- GPS data
- Climate simulation models, and
- Earth observation systems to strengthen environmental monitoring and support sustainable development initiatives.
Confidently start your Climate Research Project today. We pledge never to leave your side any time you need Help with ArcGIS Assignments!
Climate Change Prediction and Modeling
The brains behind ArcGIS intended it for predictive analytics and climate modeling. Science was tasked with simulating future environmental conditions and predicting:
- Temperature increases
- Flood occurrence
- Drought frequency
- Forest loss
- Agricultural productivity changes
- Biodiversity threats, and
- Urban climate risks
Predictive geospatial analysis made ArcGIS the go-to platform for governments and climate research organizations to develop sustainable mitigation strategies. Latter-day versions of ArcGIS tools improve environmental decision-making and disaster preparedness by supporting:
- Raster data analysis
- Spatial interpolation
- Statistical modeling
- Geoprocessing techniques and
- Scenario-based forecasting
Other Uses of ArcGIS in Climate Analysis
Disaster Risk Management and Environmental Policy Planning
ArcGIS helps authorities and environmental agencies to identify disaster-prone regions, plan evacuation routes, improve emergency response systems, conduct hazard mapping, and supports environmental conservation / land-use planning.
Data Visualization and Communication
The strongest advantages of ArcGIS is the ability to present complex climate data through interactive maps, dashboards, and visual reports. This means researchers can create: climate change maps, heat maps, environmental dashboards, interactive geographic reports, and time-series environmental maps.
Stop Struggling!
Don’t let hard geospatial analysis techniques, limited GIS software skills, data interpretation challenges, or large environmental datasets get in your way. Hire a cheap ArcGIS assignment expert for one-on-one assistance TODAY!